Start by writing this simple C program in Code::Blocks
 You should see something like this
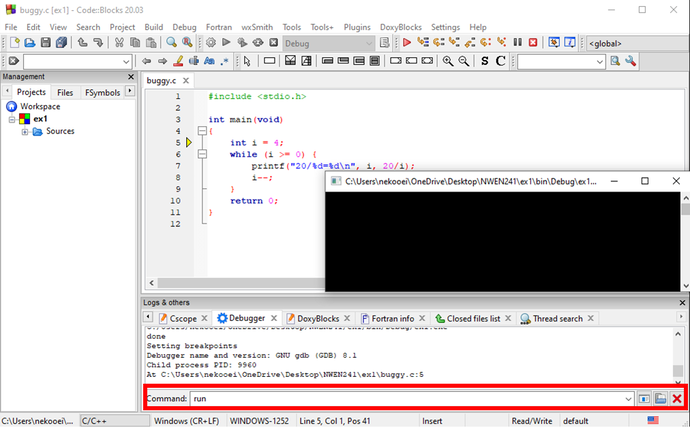 When you see the debugging information in the logging panel at the bottom of the Code::Blocks window, that means
 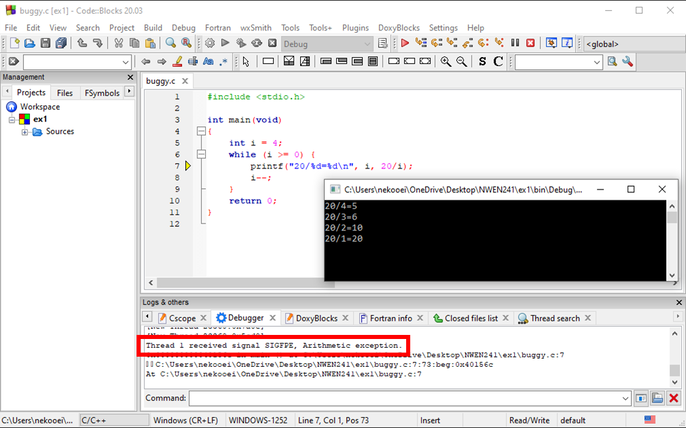 You can see the program output prior to the exception, and more importantly, the details of the exception and the exact line that caused the exception.
From the above output, you should see that the problem (
 To run the program again, just type
 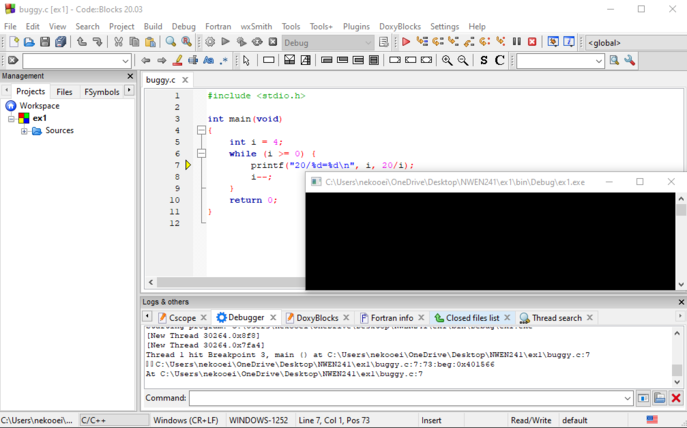 At this point, program execution paused at line 7 because of the breakpoint. You probably want to view the value of some variables in the program at this point. You can use the
 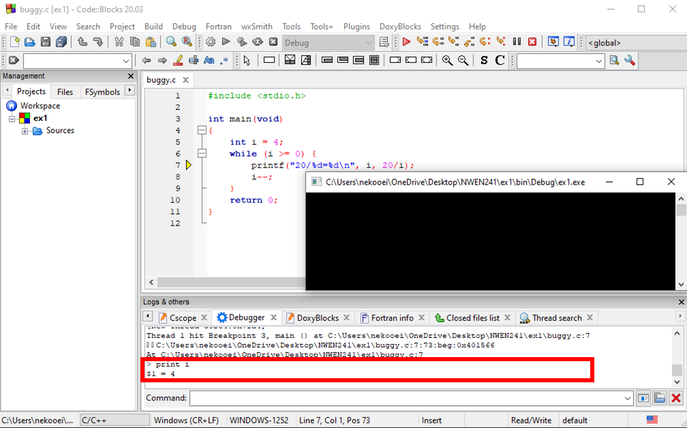 The output tells you that the current value of
 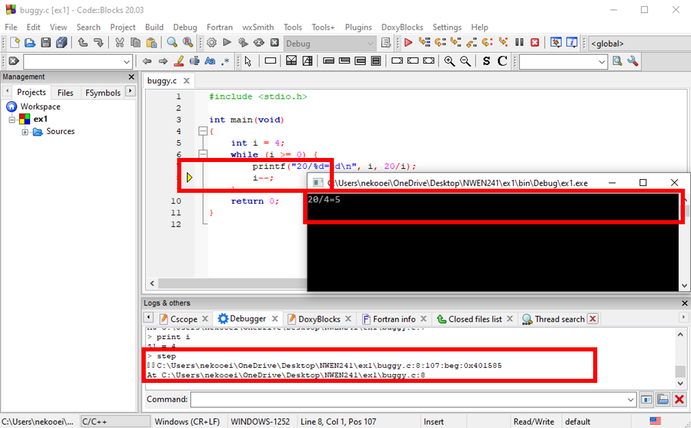 As you can see, line 7 is executed, generating the output 20/4=5. The program is now halted at line 8. Try using the
 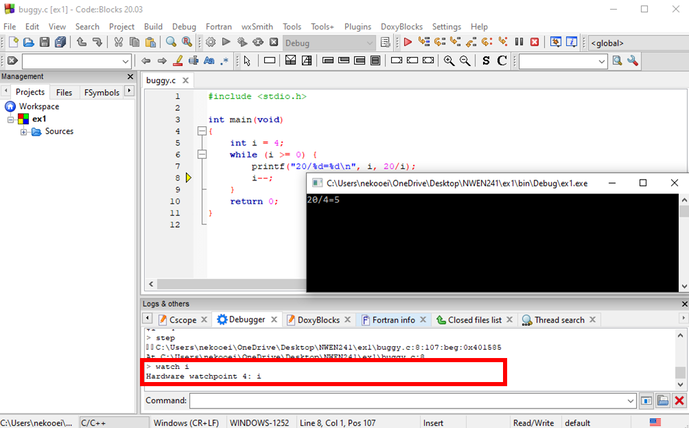 If instead of stepping you want the program to continue execution until the next breakpoint, just use the command
 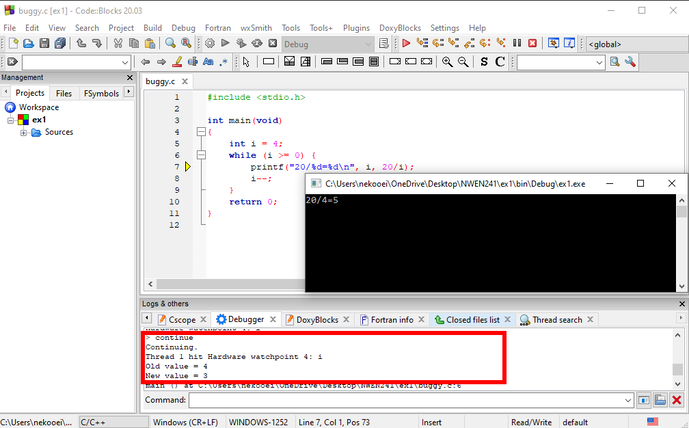 Note that program is paused after the change of variable \texttt{i} from \texttt{4} to \texttt{3} because of our watchpoint on
 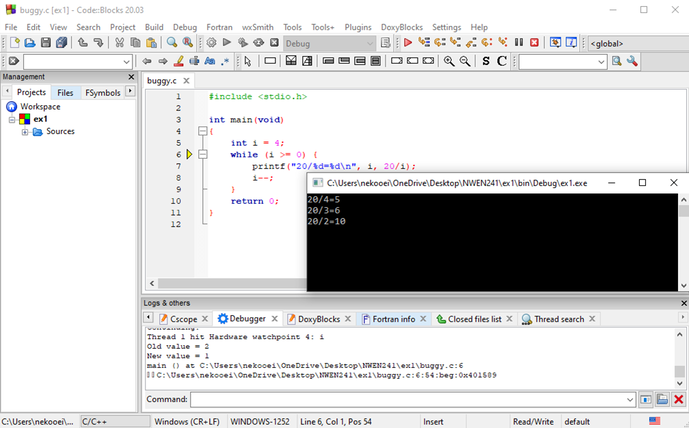 Finish the debugging until the exception is encountered.
To quit
#include <stdio.h>

int main(void)
{
   int i = 4;
   while (i >= 0) {
      printf("20/%d=%d\n", i, 20/i);
      i--;
   }
        return 0;
}
Build and run. See whether it works. The program will terminate abnormally:
As you can see, the exception message is not helpful at all. We will now use gdb to investigate this issue.
- Click the cursor in your code right before the int i = 4; statement. That would be at Line 5.
- Click the Run to Cursor button on the Debugging toolbar.
- The program runs, but only up to the cursor’s location. The output window appears, and debugging information shows up in the logging panel at the bottom of the Code::Blocks window.
 You should see something like this
 When you see the debugging information in the logging panel at the bottom of the Code::Blocks window, that means
 gdb is ready to accept commands. You may now run the program within gdb by typing run in the Command. You should see something like this:
 You can see the program output prior to the exception, and more importantly, the details of the exception and the exact line that caused the exception.
From the above output, you should see that the problem (
You can see the program output prior to the exception, and more importantly, the details of the exception and the exact line that caused the exception.
From the above output, you should see that the problem (arithmetic exception) happens at line 7. Since there is only one arithmetic operation in that line (the operation 20/i), you are certain that this is the issue. In fact, the problem occurs when i becomes 0 causing the operation 20/i to throw the arithmetic exception because division by 0 is illegal. One possible fix is to change the condition in the while-loop on line 6 from i >= 0 to i > 0.
If you want to know more about the context of the exception, you can use the command list. This command shows the code around the exception.
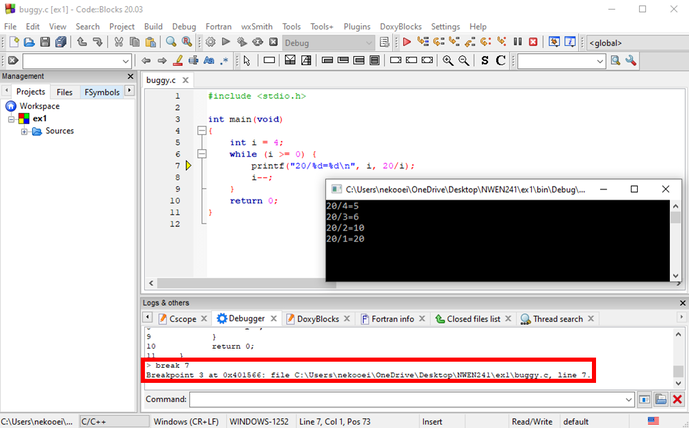
Let's do more advanced stuff with gdb. Let's begin with breakpoints. If you want to insert a breakpoint at line 7, just type the command break 7.
 To run the program again, just type
 run. Answer yes when gdb asks whether you want to start from the beginning. You should see this:
 At this point, program execution paused at line 7 because of the breakpoint. You probably want to view the value of some variables in the program at this point. You can use the
 print command to do this. For instance, to view the value of i in our program, just type print i.
 The output tells you that the current value of
 i is 4. To let the program run execute the current line, you can use either the step or next command. There is a subtle difference between these commands: -
stepwill step over functions -
nextwill actually step into functions
next, gdb will enter into the printf() function and execute the function line by line. We don't want this. What we want is for printf() to be executed as a single line, i.e., we want to step over printf(). The appropriate command for this case is therefore step.
 As you can see, line 7 is executed, generating the output 20/4=5. The program is now halted at line 8. Try using the
 print command to display the value of i. Since line 8 is not yet executed, i should still be 4.
Note that using print to track a variable is cumbersome. A better way is to use the watch command. To watch variable i, just type watch i. This command will cause program execution to be paused every time i is modified.
 If instead of stepping you want the program to continue execution until the next breakpoint, just use the command
 continue.
 Note that program is paused after the change of variable \texttt{i} from \texttt{4} to \texttt{3} because of our watchpoint on
 i. Type continue to proceed.
If you want to delete all breakpoints, use the command delete. To delete a specific breakpoint, specify the number, for instance, to delete the first breakpoint, type the command delete 1. Try doing this followed by continue.
 Finish the debugging until the exception is encountered.
To quit
 gdb, just type q.
