Tutorial - Eclipse: Debugging
Debugging
This tutorial is on how to start up the eclipse debugging mode and do some basic debugging. There is also a tutorial available on
advanced debugging.
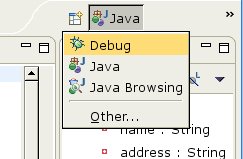
To start debugging your code the first thing you should do is switch to the debugging perspective. To do
this click on the perspective selection button and select Debug.
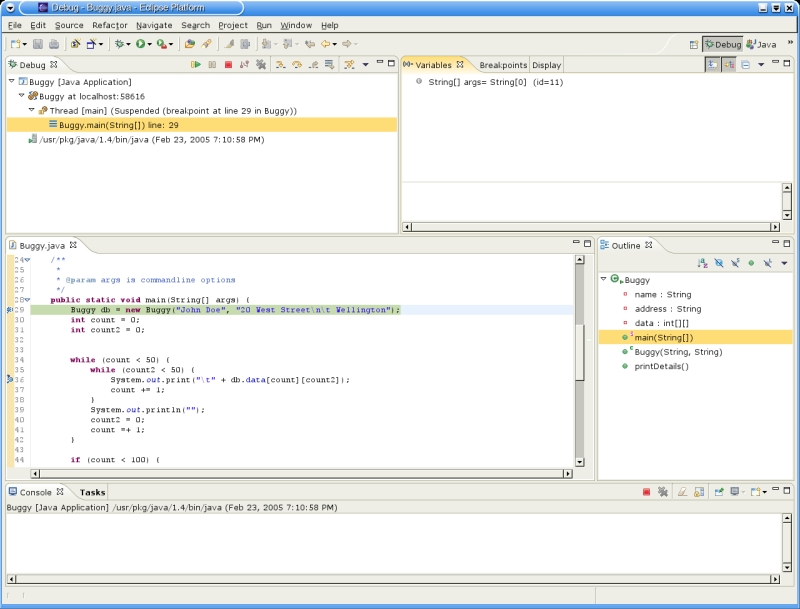
Now that you are in the debugging perspective lets look at what is there. The views that are useful in
this mode are Debug, Variables, Breakpoints, Display and Console.
- The Debug view tells you what state your program is in. This might be things like
Suspended (breakpoint ...) or terminated.
Note you should right click on any old runs of your project and select Terminate and Remove. If you don't terminate and remove your old runs, you will end up with a huge list in your Debug view.
- The Variables view shows you the variables that were defined in your program at the point when the code was suspended. It will also let you change the values of those variables.
- The Breakpoints view will list all of the existing breakpoints. You can check and uncheck them as required (only checked breakpoints will stop the code during execution). You can also right click on breakpoints and change their properties.
- The Display view is a place where you can put code and execute it at the current point and context that your program is suspended in. We will look at this more on the advanced debugging page.
- The Console view is where System.out.println prints to and where error messages appear.
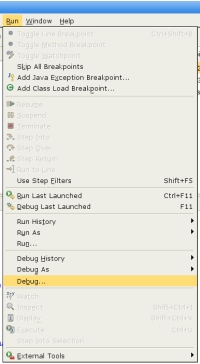
To run your code in Debugging mode you need to follow steps that are similar to the ones you follow for running your code normally. Initially you will need to go to the Run menu and select Debug...
This will open a new window that looks a lot like the run menu. Select Java Application and then click new. Make sure that the Project and Main class fields are filled in correctly then click debug. From now on you can just click on the Debug button

to debug using the last Debug mode settings.
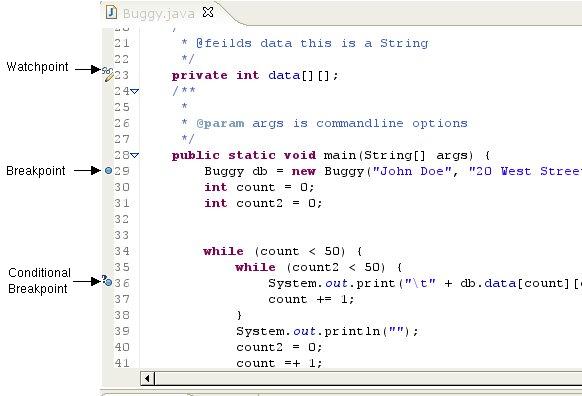
One of the most important aspects to any debugging is that you can set breakpoints. A breakpoint is a point in the code that you want to suspend your program. Once your program is suspended you can look at the variables view to see the current state of fields and objects in your code.
The basic way of setting a breakpoint is by marking a line as a breakpoint. This means that when the program reaches that line it will be suspended and you can look at the current state of the program. This basic type of breakpoint is good when you know roughly where the bug is and you just want to stop the program just before it and look at its state.
In Eclipse if you mark a line that contains a field declaration it will add a watchpoint (a special type of breakpoint). A watchpoint will suspend your code when that field is accessed or changed.
This can be useful if you have some value that seems to get changed and you don't know why. In either case setting a breakpoint or a watchpoint is the same, you simply click on the grey bar
to the left of your code (sometimes this can mean a bit of clicking around till you get the right spot).
Once the breakpoint is set run your code in Debugging Mode.
The last thing we will look at in this tutorial will be stepping around your program. There are three types of step button that you might want to use as well as a few other buttons that are useful.
The buttons are all on the Debug view toolbar. The first is Resume

this will restart your program after it has been suspended. Pause

this will suspend your program if you click the button while your program is running. Terminate

this will end your program (after this you can't resume it).
Step into

this will step one line forward unless that line has a method call. If there is a method call then the step into button will stop the program on
the first line of the method that was called. Step over

will just complete the
current line and step to the next line. Finally, step return

will complete all the code until the method the program is suspended in is completed.
Note: There is a minor bug in Eclipse that means that you have to move the mouse off the button and back to click the button repeatedly.
Now that you have gone through this tutorial on the basics of debugging you could move on to the tutorial
on
advanced debugging.
Starting up | Hello World | Running Programs | Export to Jar | Advanced Debugging
 Now that you are in the debugging perspective lets look at what is there. The views that are useful in
this mode are Debug, Variables, Breakpoints, Display and Console.
 To run your code in Debugging mode you need to follow steps that are similar to the ones you follow for running your code normally. Initially you will need to go to the Run menu and select Debug...
This will open a new window that looks a lot like the run menu. Select Java Application and then click new. Make sure that the Project and Main class fields are filled in correctly then click debug. From now on you can just click on the Debug button
  One of the most important aspects to any debugging is that you can set breakpoints. A breakpoint is a point in the code that you want to suspend your program. Once your program is suspended you can look at the variables view to see the current state of fields and objects in your code.
The basic way of setting a breakpoint is by marking a line as a breakpoint. This means that when the program reaches that line it will be suspended and you can look at the current state of the program. This basic type of breakpoint is good when you know roughly where the bug is and you just want to stop the program just before it and look at its state.
In Eclipse if you mark a line that contains a field declaration it will add a watchpoint (a special type of breakpoint). A watchpoint will suspend your code when that field is accessed or changed.
This can be useful if you have some value that seems to get changed and you don't know why. In either case setting a breakpoint or a watchpoint is the same, you simply click on the grey bar
to the left of your code (sometimes this can mean a bit of clicking around till you get the right spot).
Once the breakpoint is set run your code in Debugging Mode.
 The last thing we will look at in this tutorial will be stepping around your program. There are three types of step button that you might want to use as well as a few other buttons that are useful.
The buttons are all on the Debug view toolbar. The first is Resume