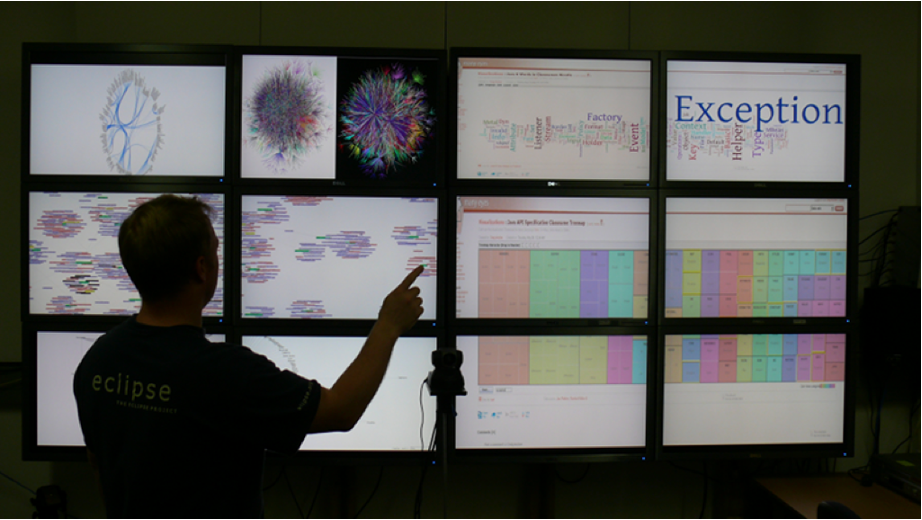
Visualizing Software Metrics with Large Displays
There are few visualization techniques for displaying complex software systems with large numbers of packages and
classes. One visualization technique is the System Hotspots View, whose effectiveness has yet to be validated by any
empirical studies. We have conducted a user evaluation to see whether participants of our modified System Hotspots
View using a large visualization wall can accurately identify key measurements and comparisons in the underlying software system. The results of our user evaluation indicate that participants were able to effectively use our modified System Hotspots View to explore the example domain: version 1.6 of the Java API. Our observations also indicate that there are issues around interacting with the visualization wall.

People
Publications:

